There are lots of complexity and nuances in the metrics you would look at around your opportunity pipeline. These continually evolve as a contractor navigates the different stages of growth and makes different strategic decisions about their markets.
At the earliest stages, there is no real opportunity pipeline. At the next couple stages, this is more specifically called a "Bid List" or "Estimating Calendar" because business development is more reactive than proactive. As contractors become increasingly more proactive about their strategic decisions, marketing, and business development, the timelines continue to increase.
Watching the metrics and trends of your opportunity pipeline along with forecasted backlog run-off, business development activity, and trends in the market are the earliest indicators a contractor has about making changes in their business.
The basic principles and math come down to this:
- Are you tracking General Opportunities like a major project owner funding expansion in the area or a bond program in the area to fund construction? If so, what is the expected timeline for those programs to start to turn into Specific Project Opportunities? Consider how Bechtel thinks about business development as an aspirational goal to get closer to each year.
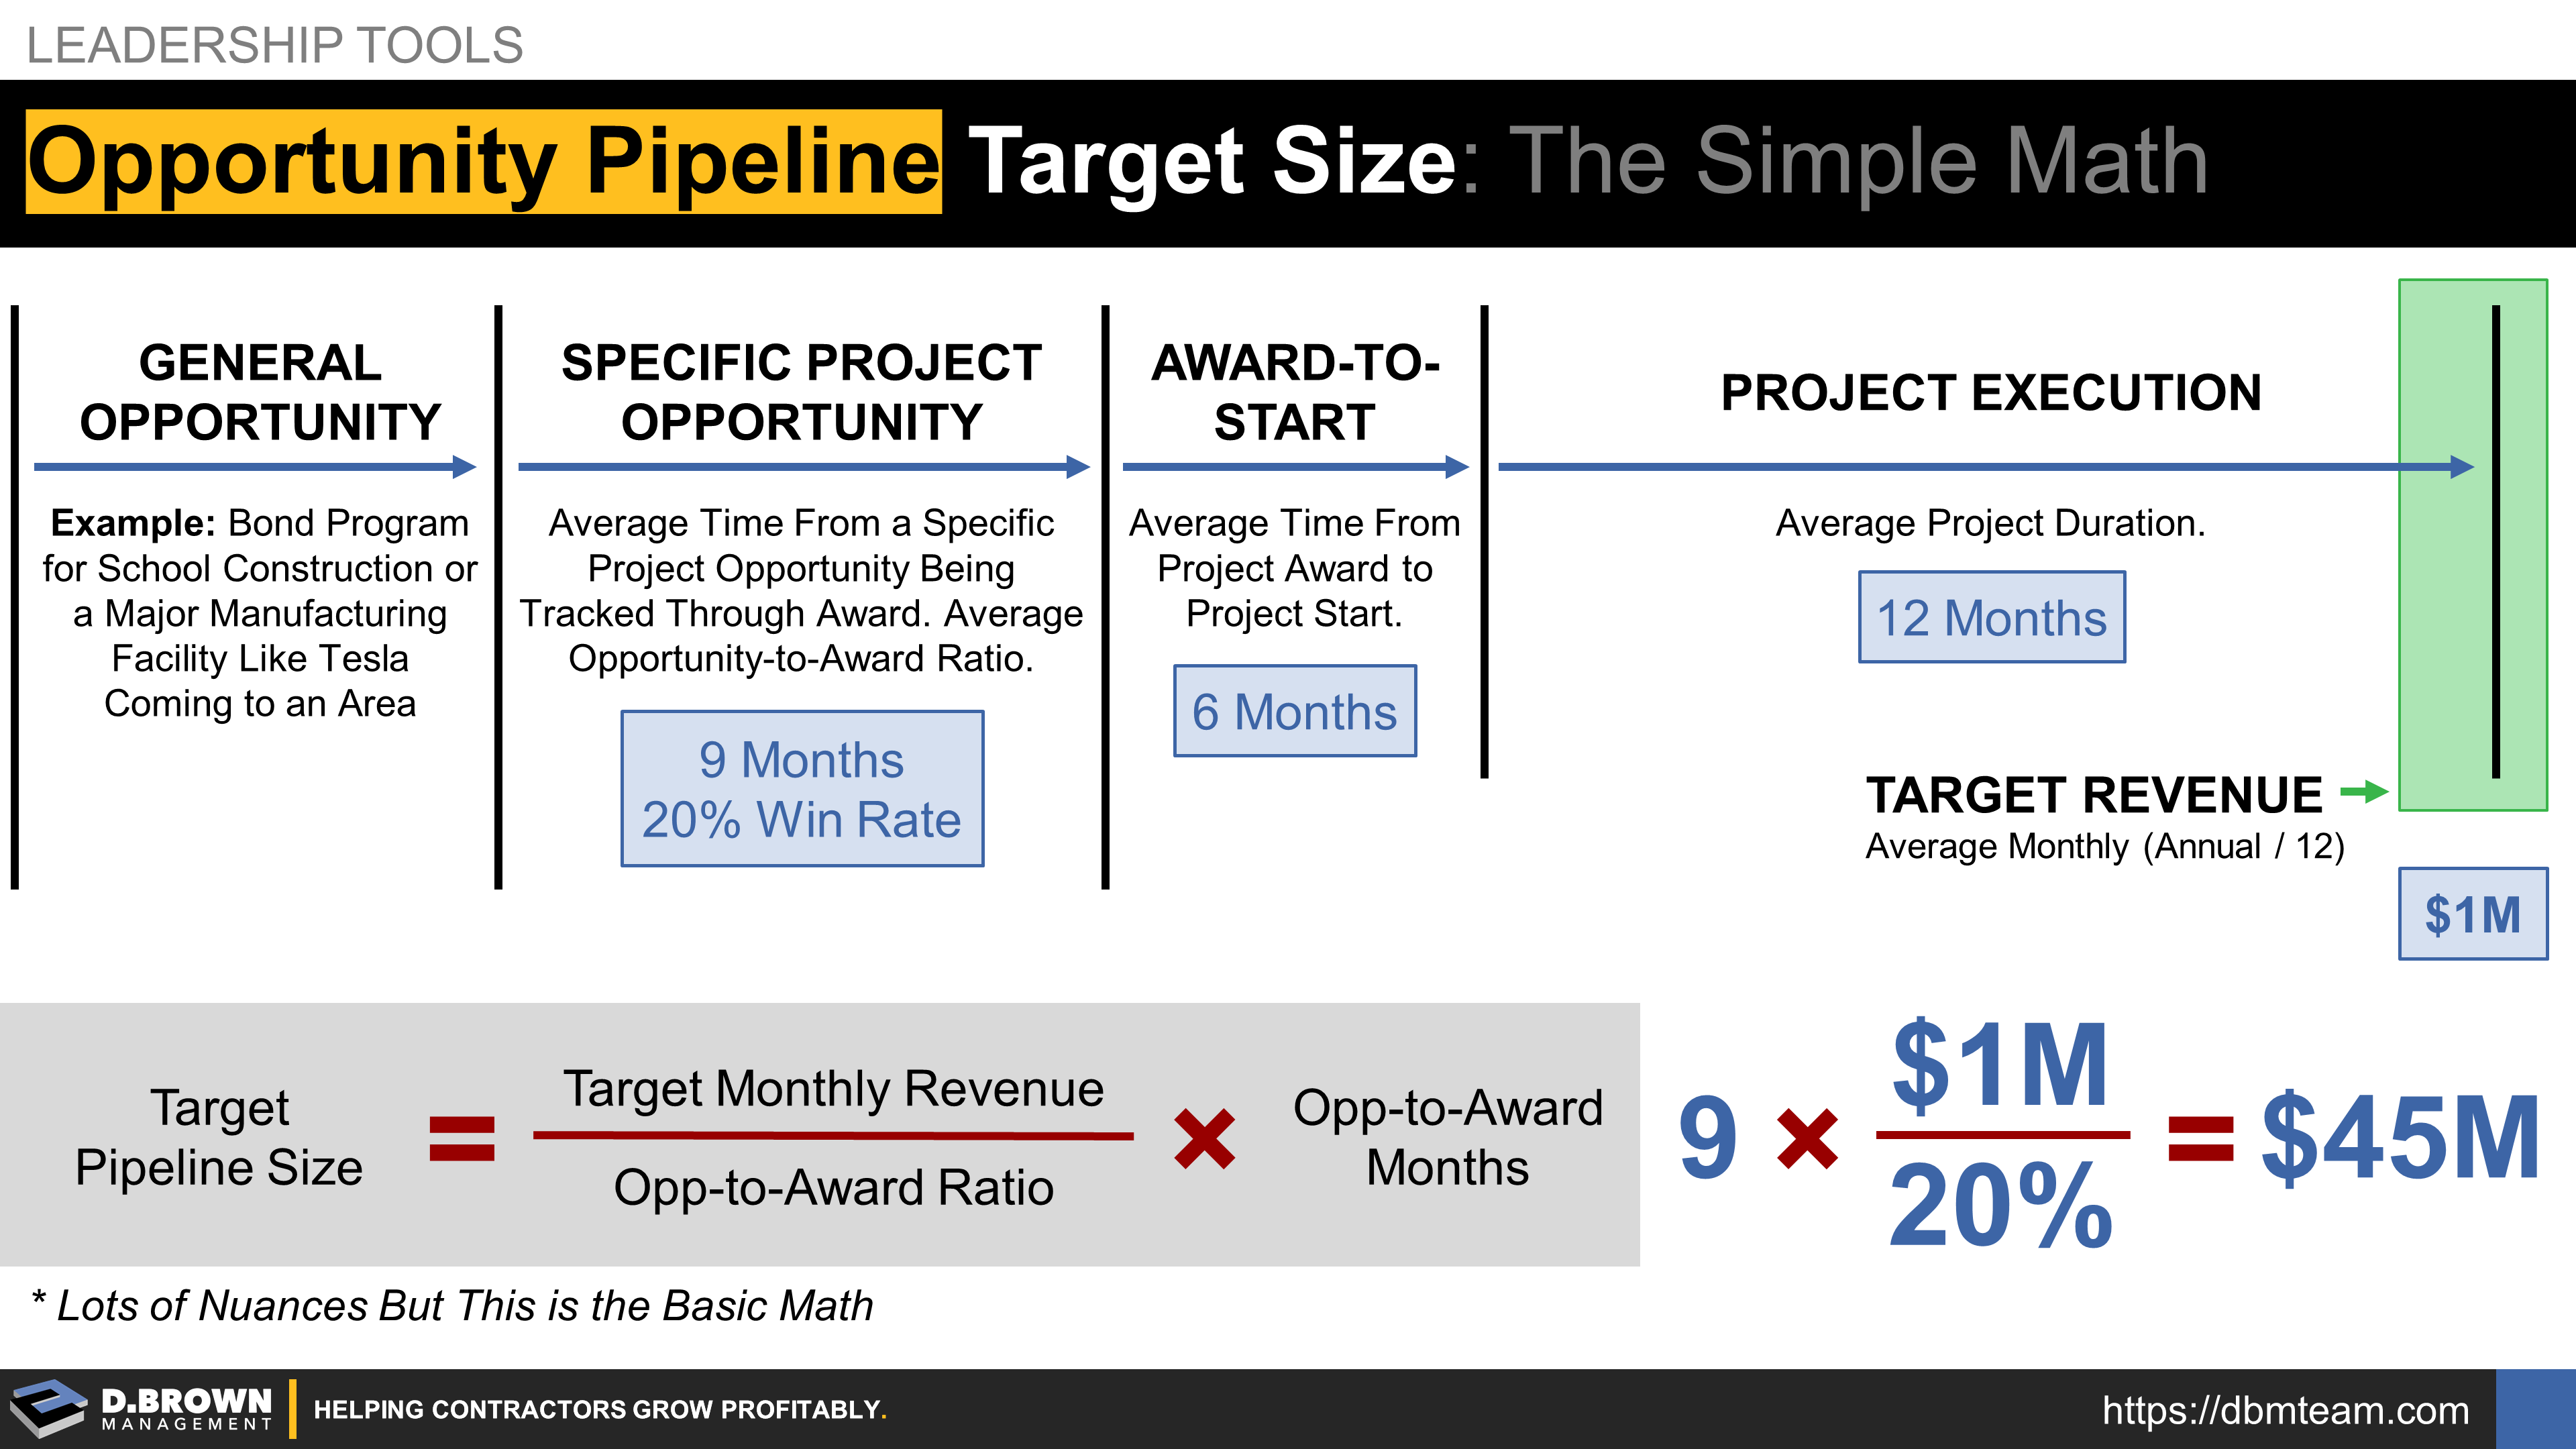
- What is the average time in months from the time you know about a Specific Project Opportunity until that project is Awarded to you or someone else? The example above is 9 months.
- What is your average Opportunity-to-Award Ratio or "Hit Rate" as a percentage? The example above is 20%.
- What is the average duration from Award-to-Start of the project? The example above is 6 months.
- What is the average duration of Project Execution? The example above is 12 months.
- Adding together the average timeline from first knowing about a Specific Project Opportunity through to Project Completion, about how long is that on average? The example above is 27 months (9+6+12).
- Given your business plan and high-level strategic targets, approximately what would you like your monthly revenue to be around the end of the project? In this example, that was $1M per month or $12M per year 27 months into the future. Note that this target may be for your whole company but by the time you are at Stage 3 and beyond, will likely be broken down a bit further by market, geography, and/or scope.
- In this example, the basic math is that the Target Size of the Opportunity Pipeline equals the Target Monthly Revenue ($1M) divided by the Opportunity-to-Award Ratio (20%) subtotaling $5M multiplied by the average number of months from Opportunity-to-Award (9) creating a target of $45M.
- Also notable is tracking the historical trend of New Opportunities added to the Pipeline each month.
Again, this is not perfect in any way but if you are over or under this by a large degree, it should be an indicator to dive deeper.