The Stress-Performance Curve (Yerkes-Dodson Law)

Achieving maximum performance from yourself and your team requires understanding the stress-performance curve as it relates both to individuals and types of work.

D. Brown Management Profile Picture
Share
Leadership Tools: The Stress-Performance Curve. Yerkes-Dodson Law. Graph comparing stress with performance and simple and complex tasks.


Stress for most people reading this will involve some combination of the following factors:

  • Time to complete the task - for instance a complex project proposal due in 3 days.  
  • Money or other things at risk - for instance; an interview for a complex project is coming up in 3 days and if you don’t win the project then you will have to lay off a project team as well as likely face a bad quarter.  
  • Overall workload - for instance; having the proposal and interview for the project in 3 days while still having the responsibilities for managing other projects and a team of people.

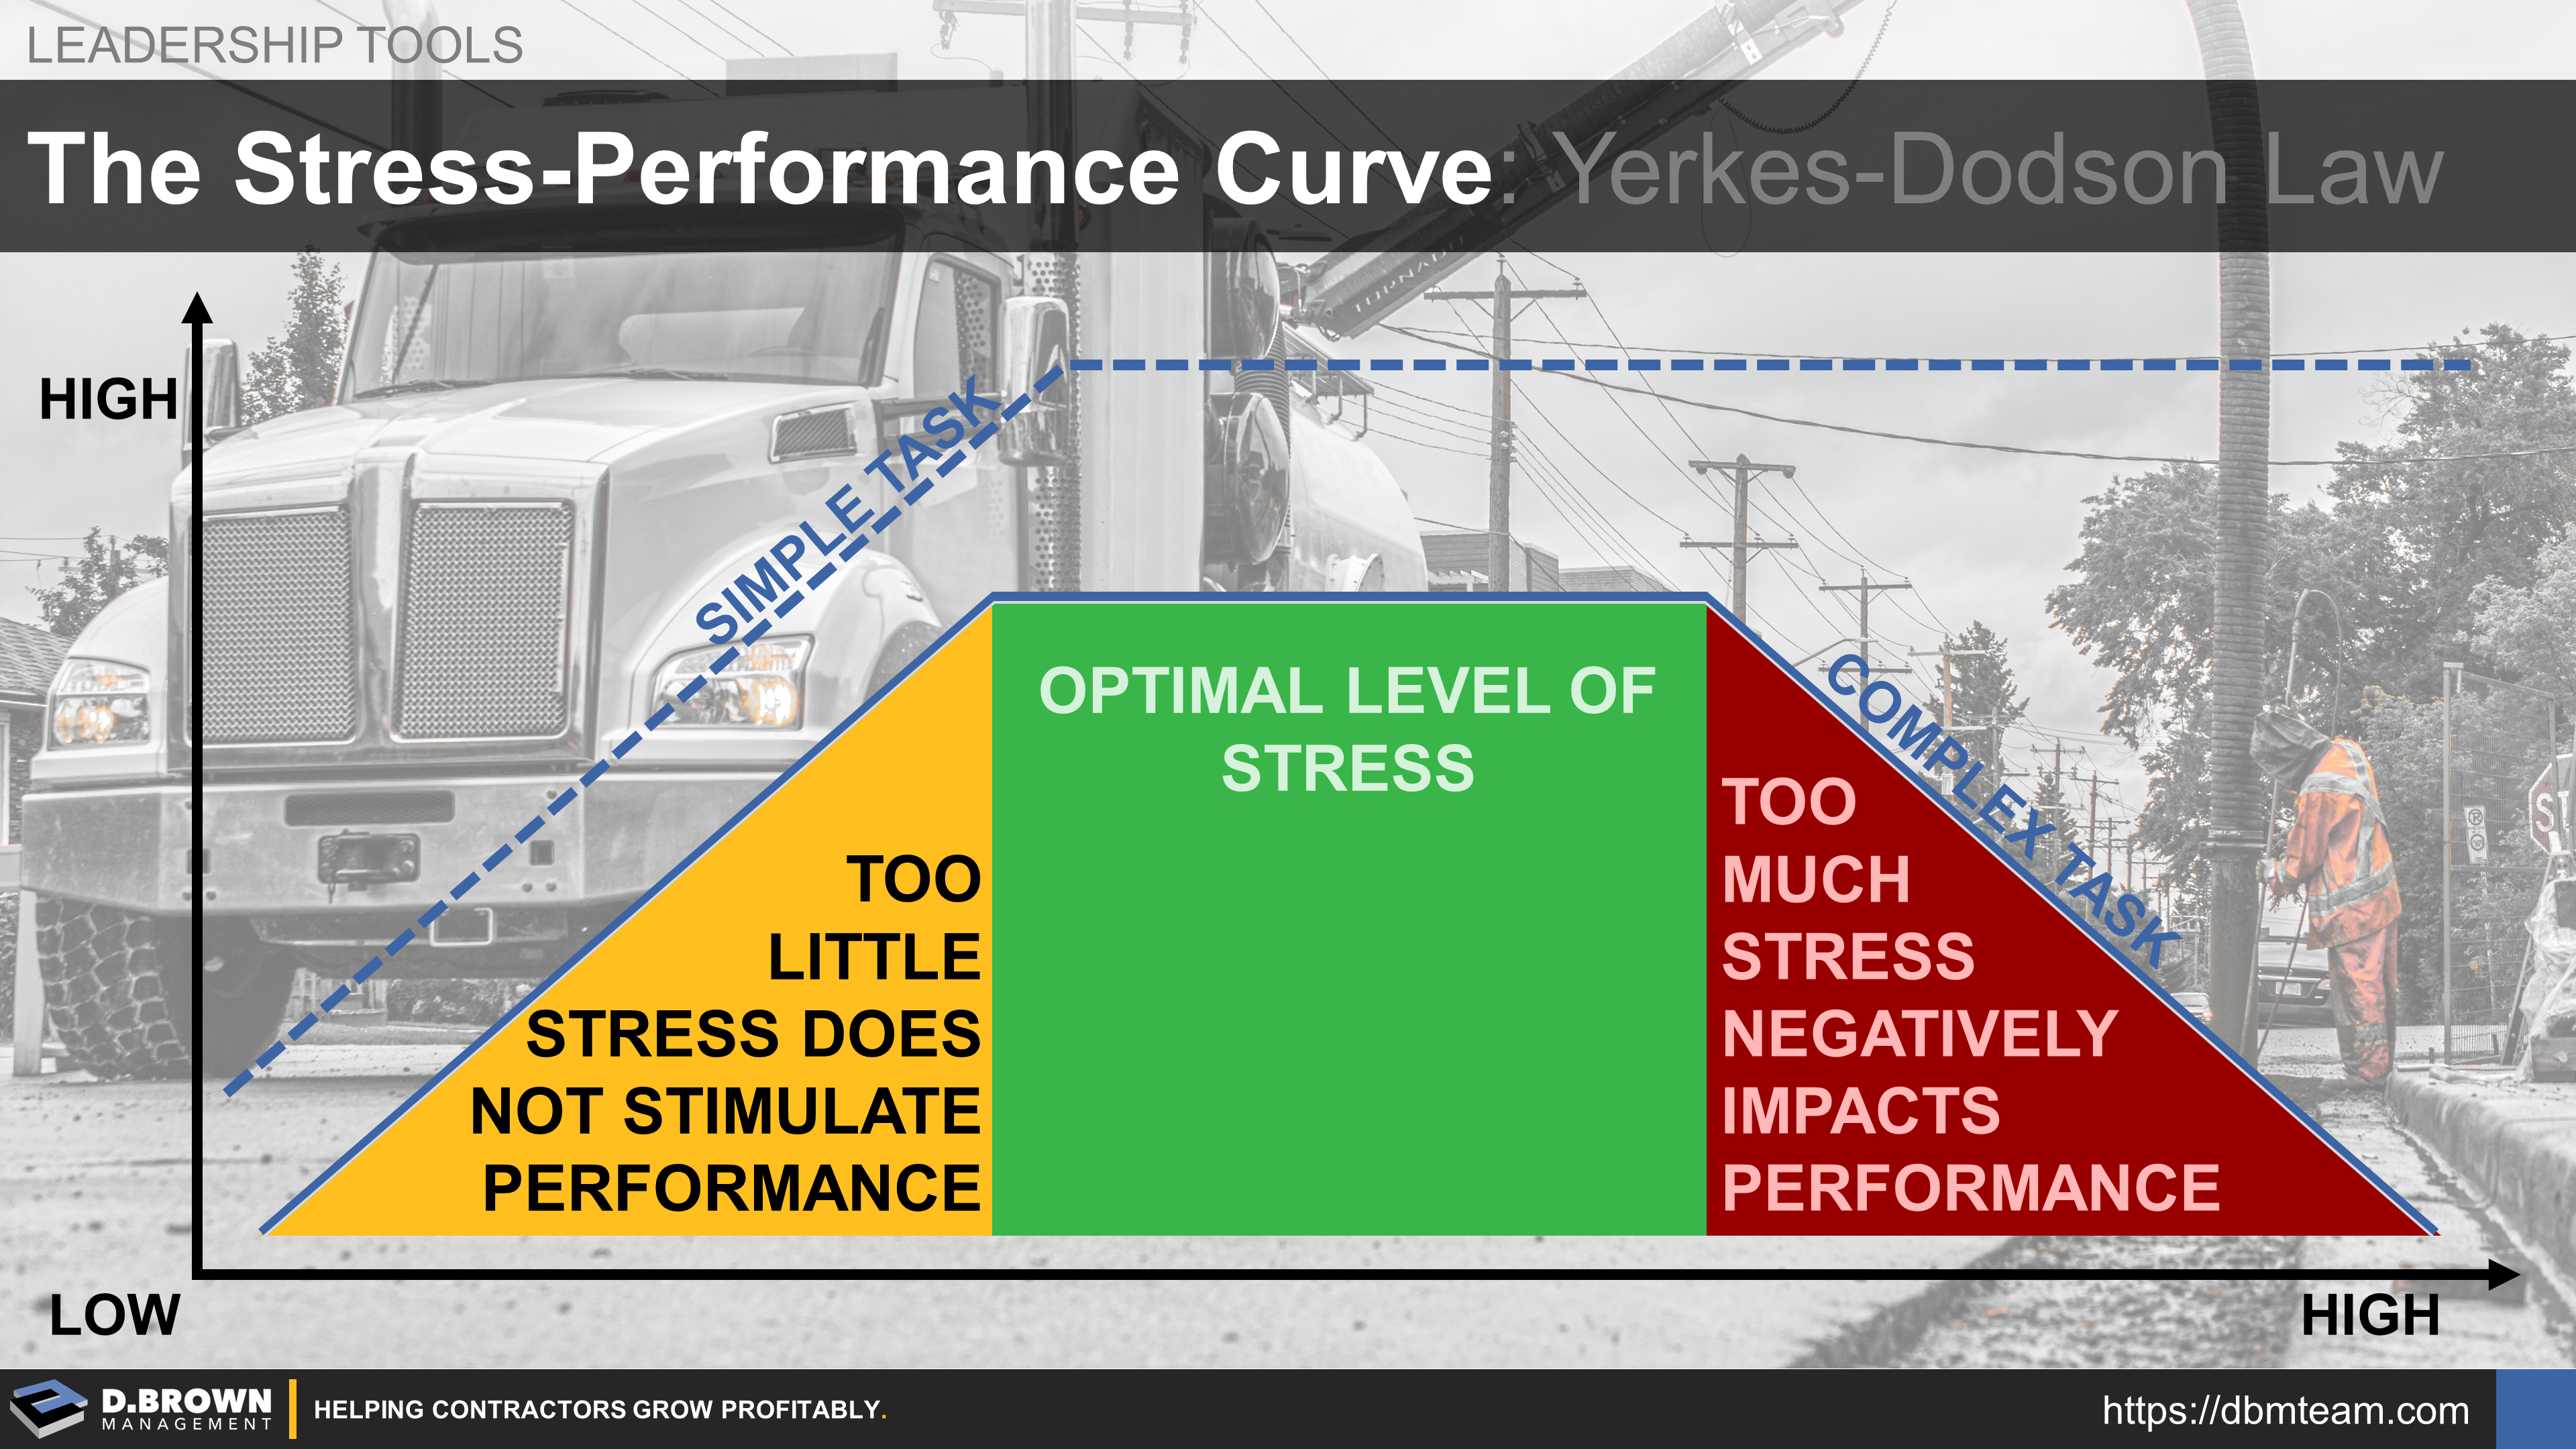
For a more complex task such as putting together the schedule for a two-year project, too much stress will impact productivity and quality leading to fatigue then burnout.  Too little stress won’t create the stimulation required for optimum productivity.  

For a simpler task such as the assembly of the final proposal documents into books is not nearly as impacted by stress with the performance curve going up and generally staying up even with high levels of stress.  


Consistently too much stress on the team as a whole could be a growth inflection point and could be due to overload which is defined as one of "The Three Enemies of Lean" in the lean body of knowledge. 


Learn More - HBR Article

Know yourself; know your team and work to keep everyone at optimum stress levels for growth.


Related Training

Building the 1000X Contractor
The craft is the foundation of the construction industry - installation delivers final value for the project owner. Aligning craft talent to build a project is difficult. Building a contracting business that consistently delivers projects is 10X harder.
Opportunity Pipeline Target Size: The Basic Math
The biggest leading indicator for performance of a contractor is the size, quality, and trajectory of their opportunity pipeline. There are lots of nuances and complexity to evaluating your pipeline, but it all starts with the principles and basic math.
Continuous Improvement - Takes or Saves Time
I am too busy to learn to improve the process! This statement is only funny because it is so true. It is one of the first mindsets you have to break within yourself and then within your team if you want to achieve consistent operational excellence.